BackdoorBench: A Comprehensive Benchmark of Backdoor Learning
Contribution analysis of BackdoorBench.
Main contribution
GOAL: Aim to alleviate the dilemma - evaluations of new methods are often unthorough to verify their claims and accurate performance.
- Open-sourced toolbox.
- 8000 comprehensive evaluations.
- Thorough analysis and new findings.
Comprehensive evaluations
The paper provide evaluations of all pairs of 8 attacks against 9 defense methods, with 5 poisoning ratios, based on 4 datasets and 5 models, up to 8,000 pairs of evaluations in total.
Compared with TrojanZoo
There are significant differences between TrojanZoo and BackdoorBench in two main aspects:
- codabase, TrojanZoo is OOP style, while BackdoorBench is POP style.
- analysis and findings are different.
TrojanZoo privode abundant and diverse analysis of backdoor learning, mainly includeing:
a. attack effects of trigger size
b. attack effects of trigger transparency
c. data complexity
d. backdoor transferability to downstream tasks
e. defense effects tradeoff between robustness and utility
f. defense effects tradeoff between detection acc and recovery capability
g. impact of trigger definiation
BackdoorBench provides serveral new analysis from different perspectives, mainly including:
a. effects of poinsoning ratios and number of classes
b. quick learning of backdoor
c. trigger generalizaion
d. memorization and forgetting of poisoned samples
e. several analysis tools
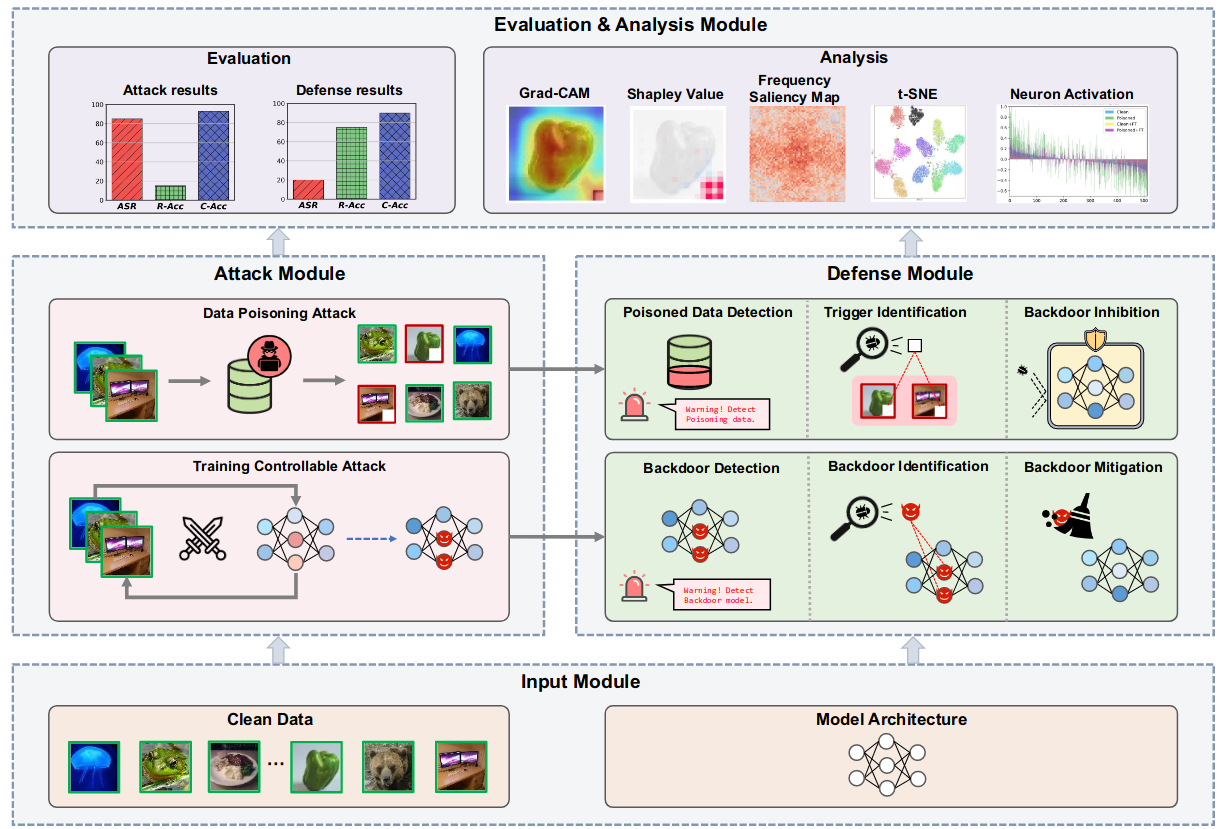
Analysis tools
t-SNEprovides a global visualization of feature representations of a set of samples in a model, and it can help us to observe whether the backdoor is formed or not.Gradient-weighted class activation mapping(Grad-CAM)and Shapley value mapare two individual analysis tools to visualize the contributions of differentpixels of one image in a model, and they can show that whether the trigger activates the backdoor or not.Frequency saliency mapto visualize the contribution of each individual frequency spectrum to the prediction, providing a novel prespective of backdoor from the frequency space.Neuron activationcalculates the average activation of each neuron in a layer for a batch of samples. It can be used to analyse the activation path of poisoned and clean samples, as well as the activation changesw.r.t.the model weights’ changes due to attack or defense, providing deeper insight behind the backdoor.
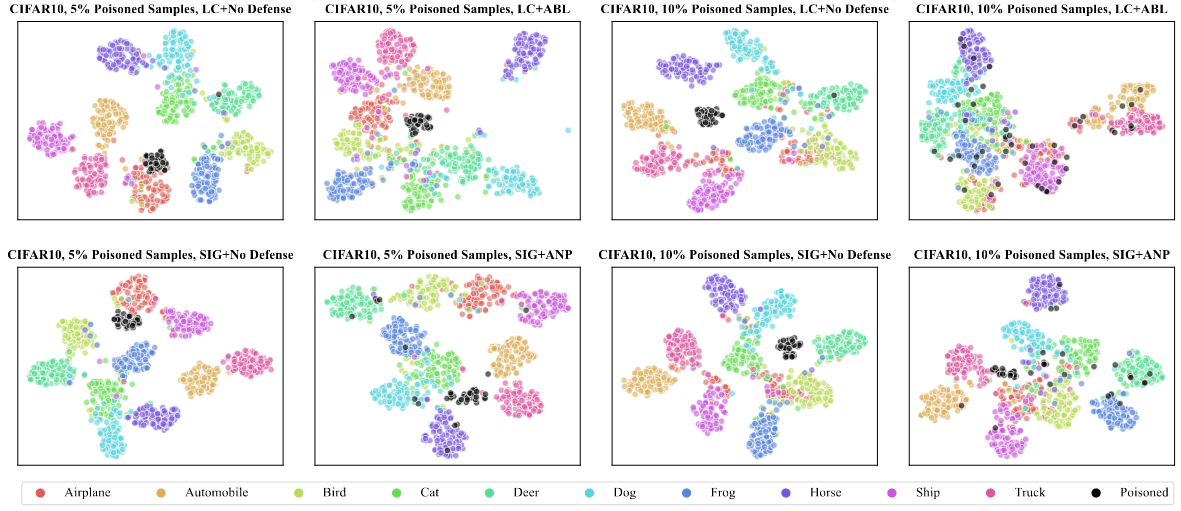
t-SNE visualization of samples
Conclusion
An open-sourced framework with backdoor attack and defense integrated.
Proposed a standard evaluation precedure with several visual analysis tool.